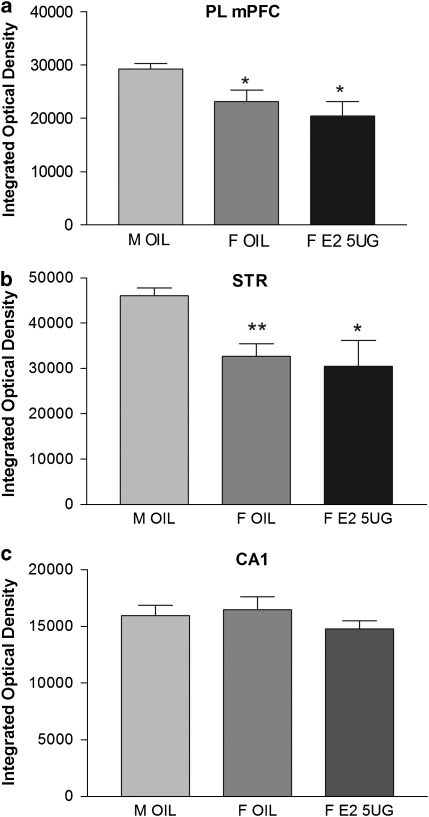
Figure 4.
Sex differences in zif268 mRNA expression following social interaction test: sham male rats (M OIL, n=8) showed greater zif268 mRNA expression in the cg1, PL and IL medial prefrontal cortex (only PL mPFC is represented in (a)) and dorsal striatum (STR) (b) when compared with ovariectomized female rats treated with oil (F OIL, n=8) or treated with E2 5 UG (n=8). The three groups showed the same zif268 mRNA expression in hippocampal CA1 region, CA3, and DG (only CA1 is represented in (c)). *p<0.05, **p<0.01.

