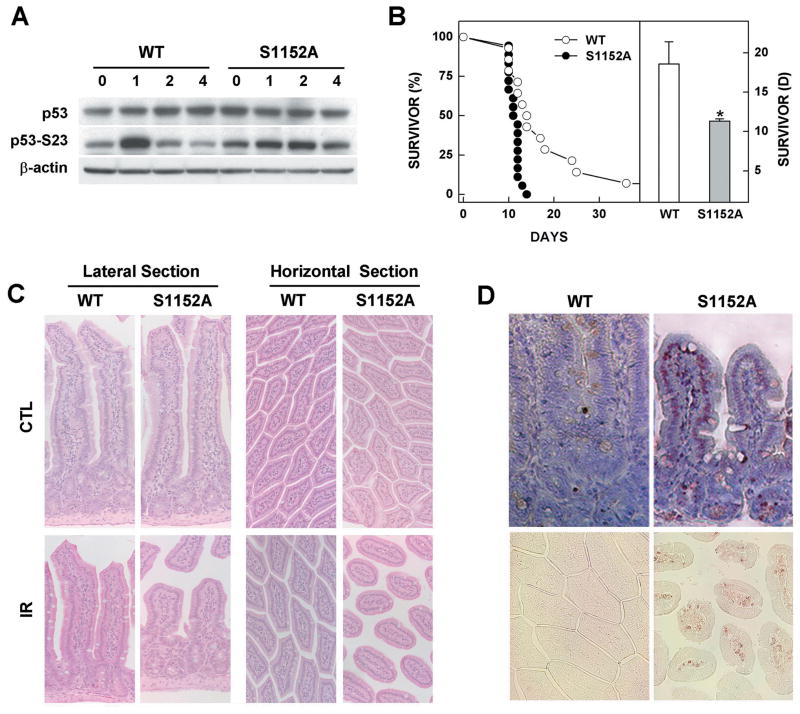
Fig. 4. Phenotypes of the Brca1S1152A/S1152A mutant in response to γ-irradiation.
(A) Protein expression patterns in MEFs from wild-type and Brca1S1152A/S1152A embryos after 10 Gy irradiation. (B) Kaplan-Meier survival curve of 4-weeks-old Brca1S1152A/S1152A (n=18) mice and wild-type littermates (n=14) after exposure to 8 Gy of irradiation. Statistically significant differences (P<0.01) are indicated by asterisks. (C) Lateral and horizontal sections of small intestines from 8 Gy-irradiated wild-type and Brca1-S1152A mutant mice. (D) Apoptotic cells detected by TUNEL staining are shown in lateral and horizontal views in the upper and lower panels, respectively. WT, wild-type; S1152A, Brca1S1152A/S1152A.

