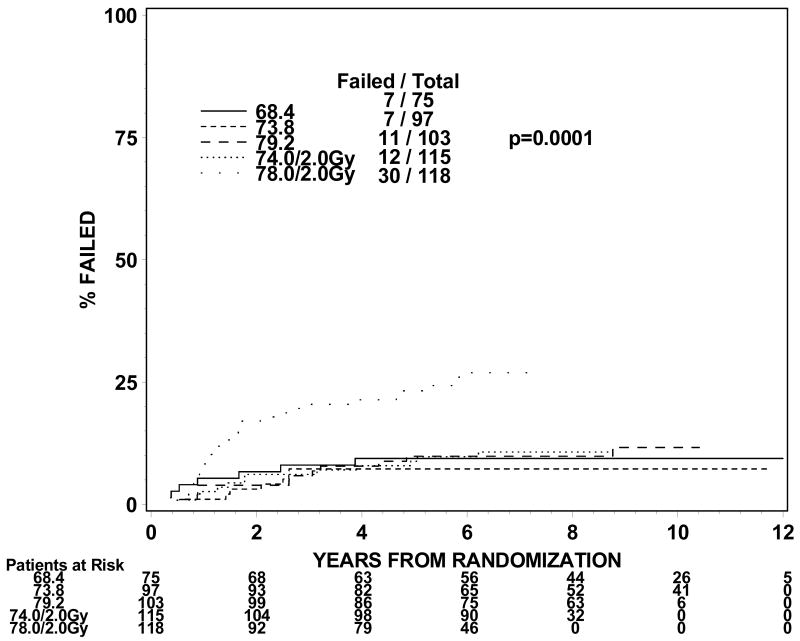
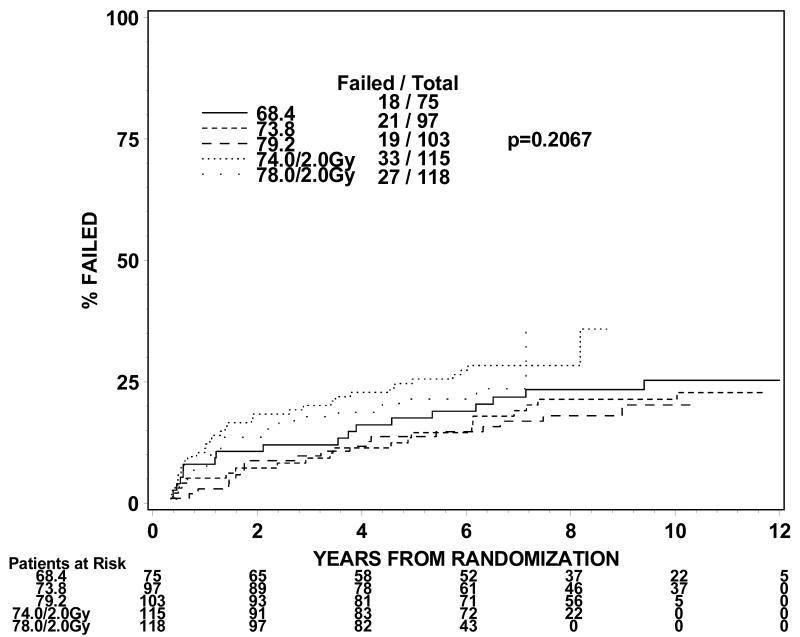
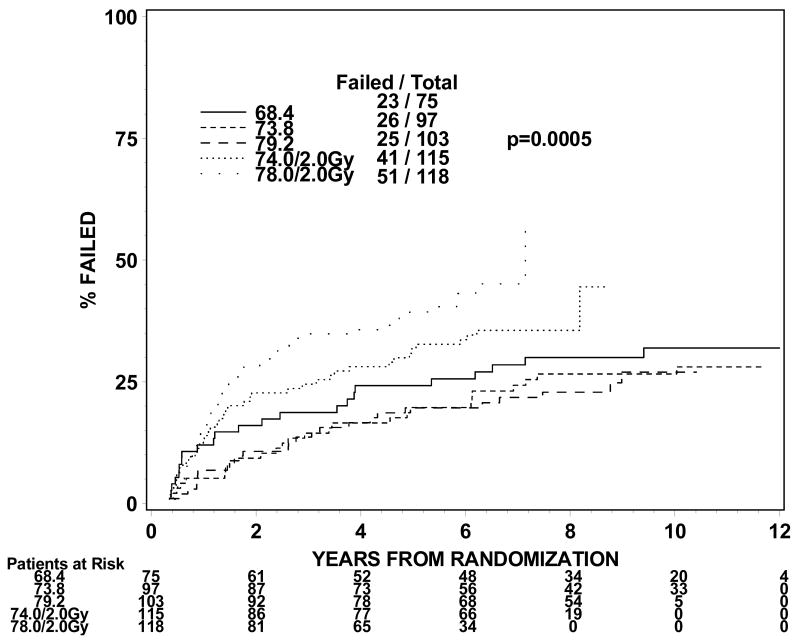
Figure 1.
Figure 1a. Disease group 1, Time to Late GI Grade 2+ (The cumulative incidence method is used to estimate the time to late GI grade 2+ failure rate and the Gray's test is used to test the difference between the levels in this univariate analysis.)
Figure 1b. Disease group 1, Time to Late GU Grade 2+ (The cumulative incidence method is used to estimate the time to late GU grade 2+ failure rate and the Gray's test is used to test the difference between the levels in this univariate analysis.)
Figure 1c. Disease group 1, Time to Late GI/GU Grade 2+ (The cumulative incidence method is used to estimate the time to late GI/GU grade 2+ failure rate and the Gray's test is used to test the difference between the levels in this univariate analysis.)


