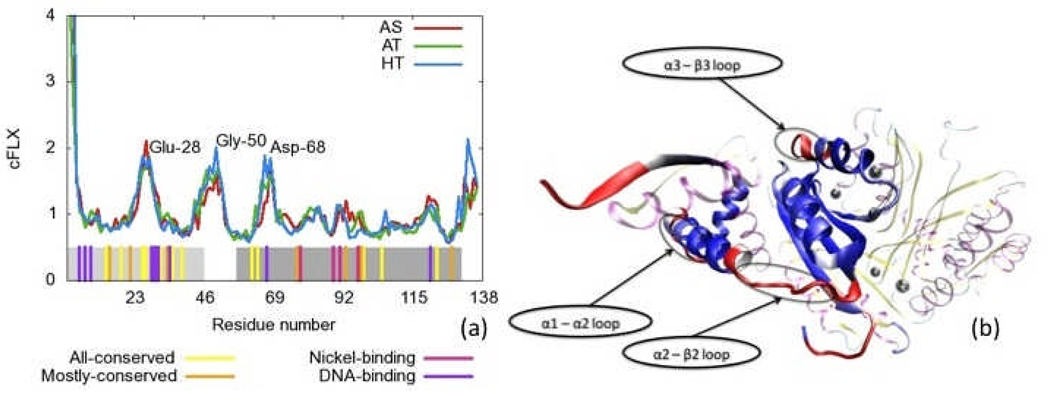
Figure 9.
Residue flexibility, cFLX, for all three simulations. a) cFLX vs. residue number. Residue identities are labeled at peak values. Bottom bars indicate residues with high conservation across species, or with either nickel or DNA binding function as labeled. Light and dark grey regions represent the DBD and MBD respectively. b) Flexibility summed over chains (cFLX) for the HT simulation applied to a color scheme (red is the highest, blue is the lowest) on a single chain the initial structure of the HT form of NikR. The rest of the protein is present but deemphasized and uses the same color scheme as Figure 1. Highly flexible regions may be key for functional conformational changes.

