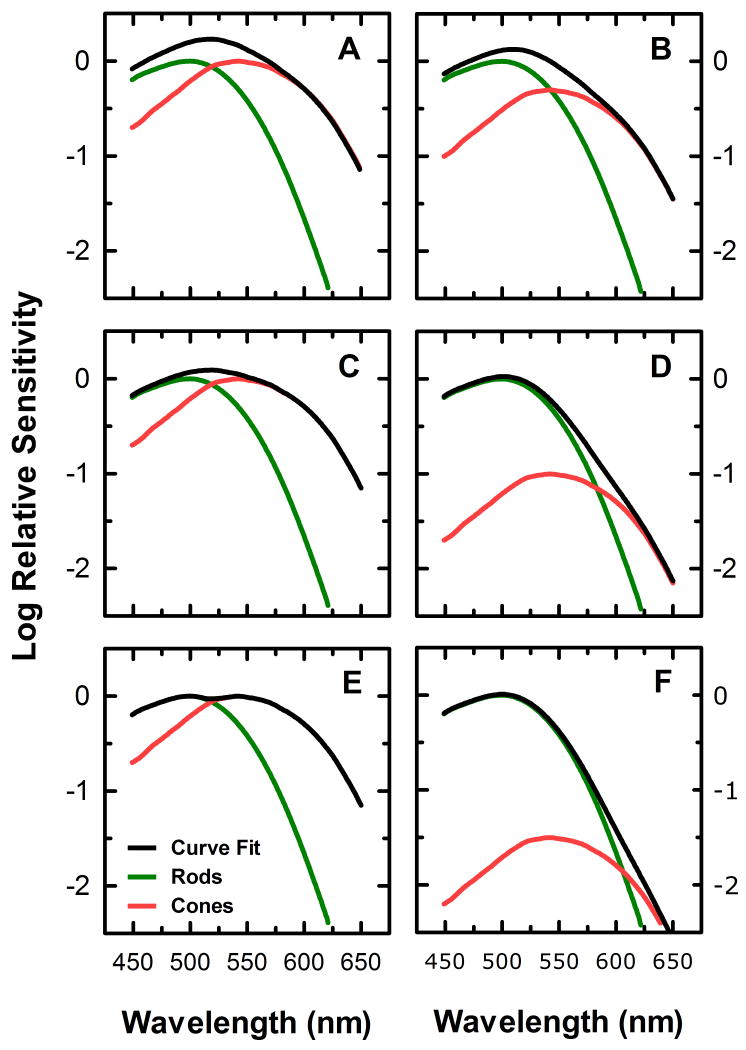
Figure 2.
Illustration of the effect of changing the curve fitting parameters of equation (4) on the composite spectral sensitivity derived from the combination of rod and cone spectral sensitivities. Panels A, C, and E demonstrate the effect of changing the value of the parameter k in equation (4) to 1 (A), 2 (C), and 100 (E). Panels B, D, and F demonstrate the effect of changing the relative contribution of the rod and cone signals on the spectral sensitivity of the overlying function, by setting c = 0.5r (B), c = 0.1r (D), and c = 0.03r (F).

