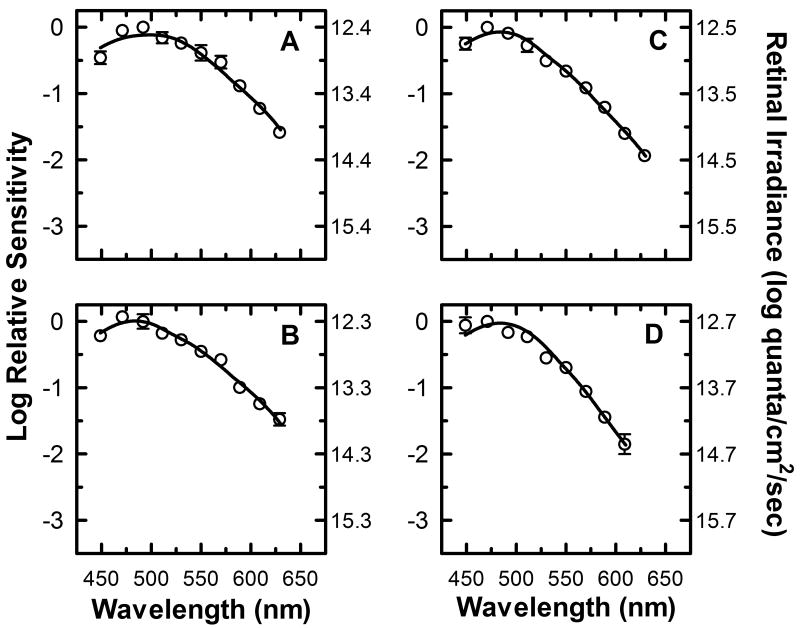
Figure 6.
Spectral sensitivity of three quarter-maximal pupillary constriction with a 50 td adapting field present. Mean spectral sensitivity measurements (n=3) at ten different wavelengths are represented by (○) for four different stimulus duration conditions, (A) 1.78 seconds, (B) 3.16 seconds, (C) 10 seconds, and (D) 31.6 seconds (SEM error bars). The left y-axis represents the log spectral sensitivity relative to the most sensitive wavelength at each duration condition. The right y-axis indicates the retinal irradiance necessary to produce the criterion response. The smooth curve through the data points represents the optimal fit to the data using equation (8), a mathematical combination of rod, cone, and melanopsin spectral sensitivities based on the Quick pooling model of visual sensitivity (see Methods and table 3 for details).

