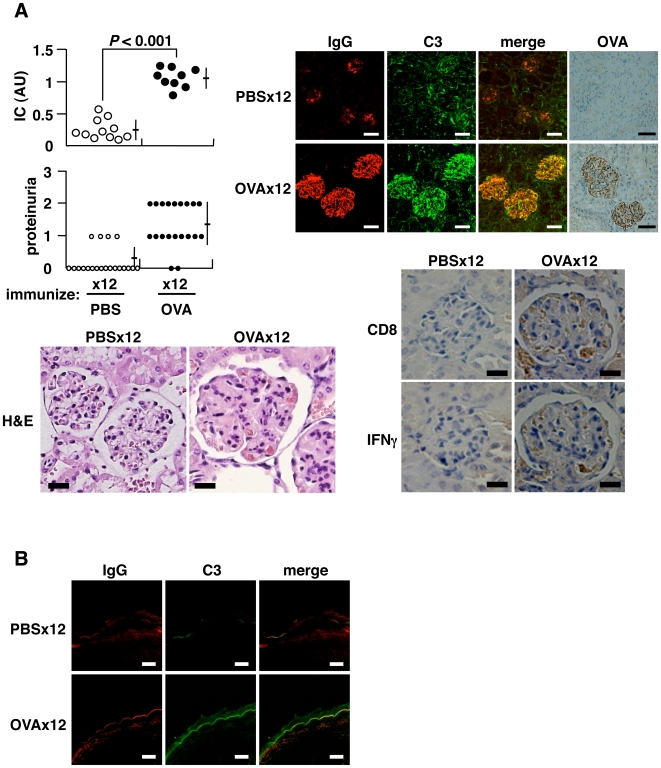
Figure 3. Induction of autoimmune tissue injury.
BALB/c mice were injected i.p. with 500 µg OVA every 5 d. (A) Serum IC measured 2 d after final immunization, expressed as AU. Proteinuria assessed 9 d after final immunization: grades 1, 2 and 3 represent 30–100 mg/dl, 100–300 mg/dl and 300–1000 mg/dl of urinary protein, respectively (upper left). Representative histopathology of kidneys from mice immunized 12× with PBS or OVA (lower left) (H&E staining, bar = 20 µm; original magnification ×400): glomerular expansion with cellular infiltration including eosinophils seen under the same magnification. Immunohistochemistry for deposited IC, IgG, C3 and OVA (upper right) (bar = 50 µm; original magnification ×200), and cells infiltrated into glomeruli (bar = 20 µm; original magnification ×300), stained in serial tissue sections using anti-CD8α (53–6.7) and anti-IFNγ (R4-6A2) monoclonal antibodies, in the specimens of mice immunized 12× with OVA (lower right). (B) Lupus band test stained with anti-IgG and anti-C3 antibodies (bar = 20 µm; original magnification ×400).

