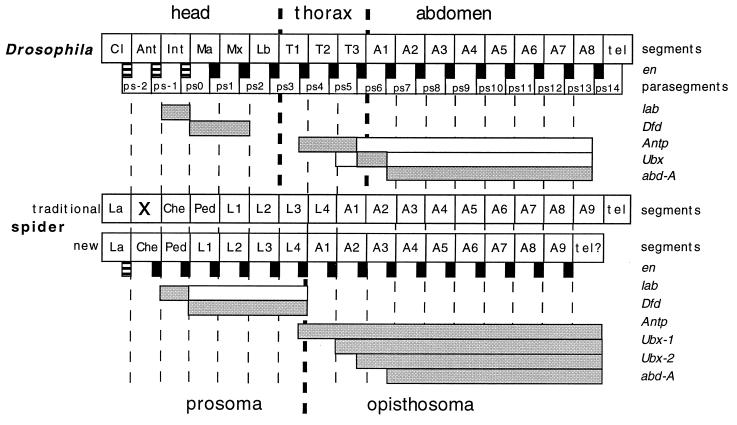
Figure 4.
Schematized interpretation of the expression boundaries of the Hox genes in Drosophila and in Cupiennius. The broken thin lines represent the segmental boundaries, and the broken thick lines represent the boundaries between the major tagmata (head, thorax, and abdomen in the fly, prosoma and opisthosoma in the spider). The EN stripes (black boxes) are located at the parasegmental boundaries in Drosophila, which also are indicated. Note that the first three EN stripes are not true stripes, but only spots of expression in the respective head segments. In the spider, we infer the same relative location of the EN stripes, where the first one again is only a spot of expression in the head (see Fig. 2E). The respective Hox gene expression domains are represented by bars. Shaded bars indicate strong expression; open bars indicate weak expression.

