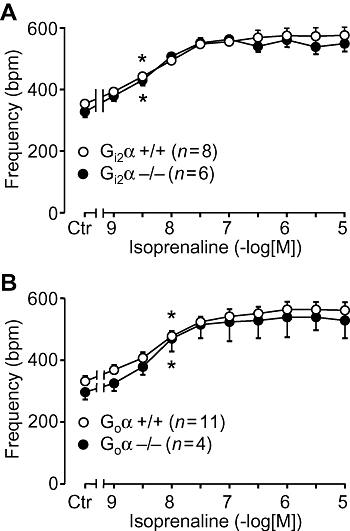
Figure 4.

Effect of isoprenaline in isolated right atria on rate of contraction (frequency) plotted in beats per minute (bpm). Ctr indicates control values (prior to drug addition). Littermate wild-type mice (+/+, open circles) are compared with Gi2α knockout (Gi2α−/−, A) or Goα knockout mice (Goα−/−, B). Numbers in brackets indicate number of mice studied. * denotes first significant difference versus pre-drug value (Ctr). No differences were detectable between wild type and knockout mice.
