
Figure 3.
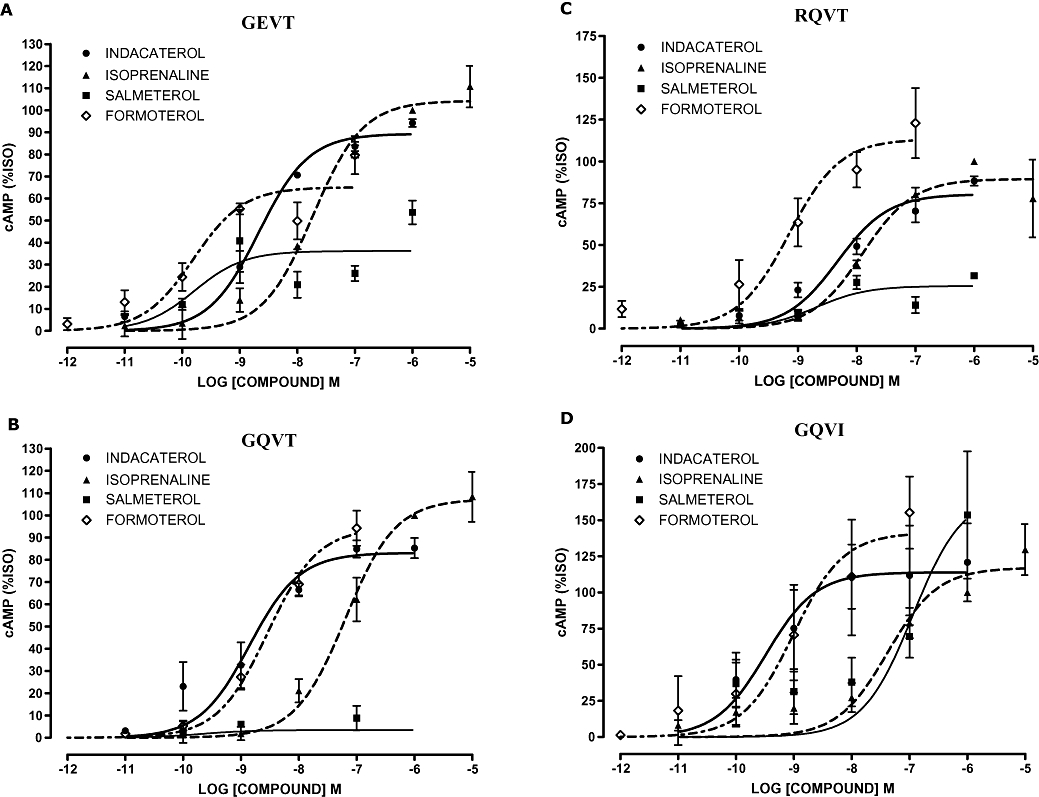
Concentration–response curves for cAMP (adenosine-3′,5′-cyclic-monophosphate) production in response to β2-adrenoceptor agonists (40 min) in the low-expression β2-adrenocepter cell lines. Variants cell lines (A) GEVT, (B) GQVT, (C) RQVT and (D) GQVI. Data were normalized to response to 1 µmol·L−1 isoprenaline (100%) in each experiment and are presented as mean percentage isoprenaline (%ISO) response; error bars represent s.e.mean (n = 3).