
Figure 5.
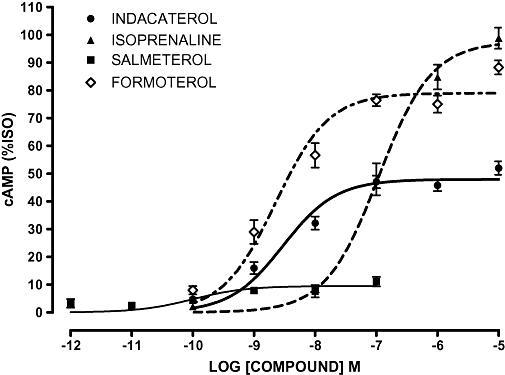
Concentration–response curves for cAMP (adenosine-3′,5′-cyclic-monophosphate) production in response to β2-adrenoceptor agonists (10 min) in human primary airway smooth muscle cells. Data were normalized to response to 1 µmol·L−1 isoprenaline (100%) in each experiment and are presented as mean percentage isoprenaline (%ISO); error bars represent s.e.mean (n = 12 − 15).