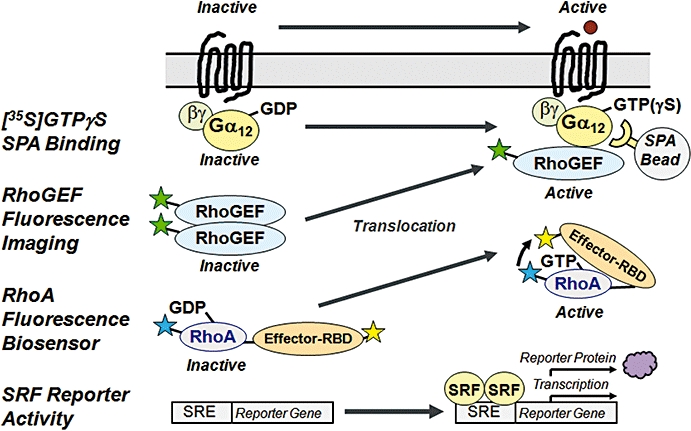
Figure 2.

Quantitative Bioassays for Activation of the G12/13-RhoGEF-RhoA Axis. Activation of G12/13 proteins is reflected by enhanced [35S]GTPγS binding to their α subunits, which are captured by antibody-linked SPA beads. GPCR-activated G12/13 mediate redistribution of RhoGEF from the cytosol to the plasma membrane, which can be visualized by tagging of RhoGEF with, for example, EGFP (or by immunostaining). Fluorescence subcellular imaging allows quantification of cytosolic and plasma membrane-localized RhoGEF using suitable algorithms. Fluorescent biosensors contain CFP-labelled RhoA fused to the Rho binding domain (RBD) of an effector protein labelled with YFP. FRET signals between the donor CFP and acceptor YFP occur upon binding of the effector RBD to activated (GTP-bound) RhoA, and can be quantified using fluorescence imaging. Activation of RhoA can be indirectly measured in an SRF-dependent reporter gene assay. CFP, cyan fluorescent protein; EGFP, enhanced green fluorescent protein; FRET, fluorescence resonance energy transfer; GEF, guanine nucleotide exchange factor; GPCR, G protein-coupled receptor; GTP, guanosine triphosphate; GTPγS, guanosine-thio triphosphate; SPA, scintillation proximity assay; SRF, serum response factor; YFP, yellow fluorescent protein.
