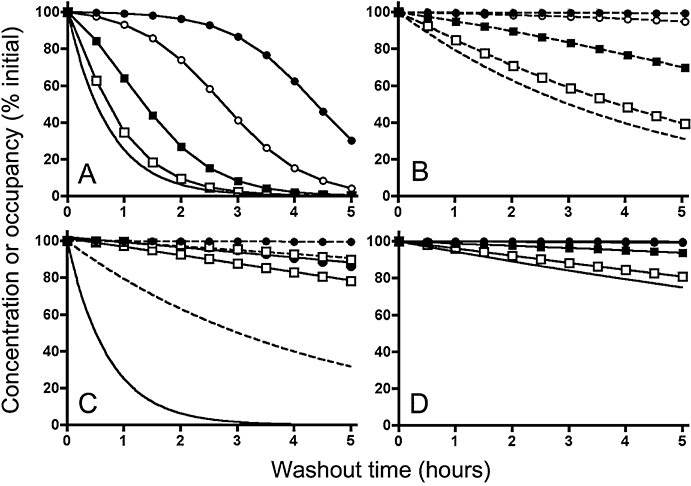
Figure 2.

Decline in receptor (active site) occupancy by a ligand with time under washout conditions. (Panels A to C): microkinetic model depicted in Figure 1A; (Panel D): exosite and rebinding models depicted in Figures 1B and 1C, respectively. Description of the simulations is provided in the Materials and Methods section. The free ligand concentration decreases exponentially with time with a t1/2 of 30 min (solid curves in Panels A and C), 3 h (dashed curves in Panels B and C) or 12 h (solid curves in Panel D). Curves without symbols represent the free ligand concentration and those with symbols represent receptor occupancy. Symbols are the same in all panels and refer to initial levels of receptor occupancy: that is, 28.6% for open squares, 80% for closed squares, 97.6% for open circles and 99.8% for closed circles (corresponding to equilibrium binding at free ligand concentration/KD ratios of 0.4, 4, 40 and 400, respectively). Ligand dissociation from the receptors occurs with a t1/2 of 3 min (Panels A, B and D) or 12 h (Panel C). For the sake of comparison, initial ligand concentrations and receptor occupancies are normalized to 100%.
