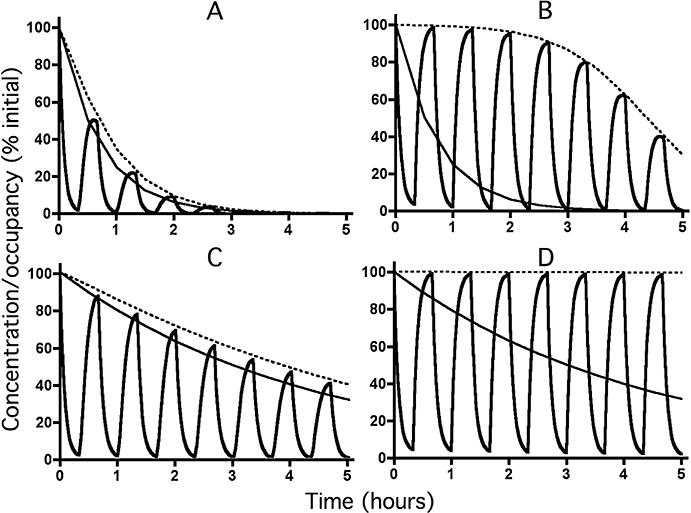
Figure 4.

Decline in receptor occupancy (bold lines) by a fast-dissociating ligand (t1/2= 3 min) with time according to the microkinetic model under reassertion conditions at low (28.6% for Panels A and C) and high (99.8% for Panels B and D) initial levels of occupancy. Simulations were carried out to mimic successive 20 min exposures to medium only and to medium containing a large excess (100 times its KD for Panels A and C and 10.000 times its KD for panels B and D) of a fast-dissociating (t1/2= 1 min) competing ligand. The free ligand concentration (slim lines) decreases exponentially with time with a t1/2 of 30 min (Panels A and B) or 3 h (Panels C and D). Dotted lines correspond to receptor occupancy under washout only (i.e. curves in Figure 2A and B). For the sake of comparison, initial ligand concentrations and receptor occupancies are normalized to 100%.
