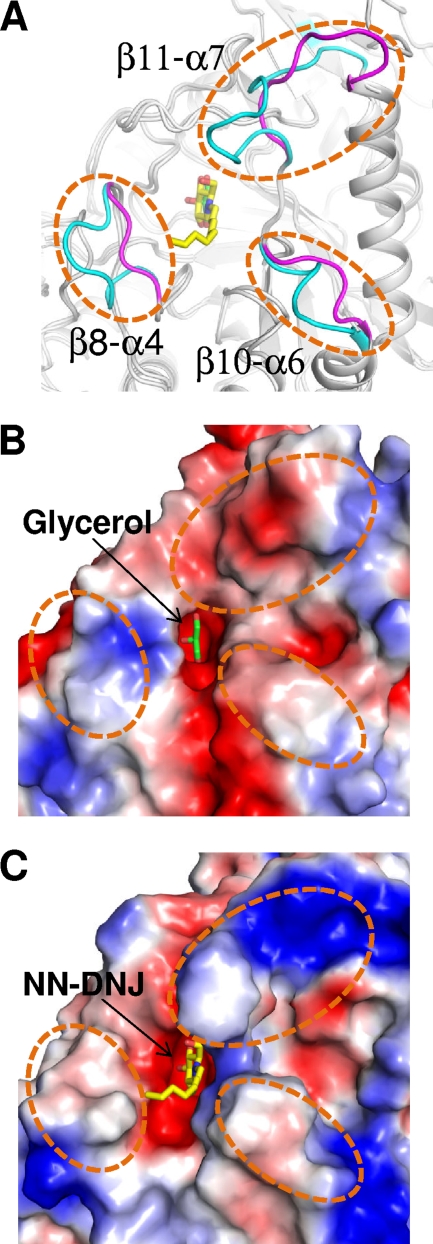
FIG. 4.
Structural differences between SrfJ and human GlcCerase. (A) SrfJ and human GlcCerase are superposed and presented in cartoon diagrams (gray). Three loops (β8-α4, β10-α6, and β11-α7) showing considerable structural differences between the two proteins are represented in magenta and cyan for SrfJ and human GlcCerase, respectively, and highlighted with dashed circles. (B and C) Surface models of SrfJ (B) and human GlcCerase (C) showing differences of electrostatic potentials at the substrate entrance regions. The figures are presented in the same direction and dimension as in panel A.

