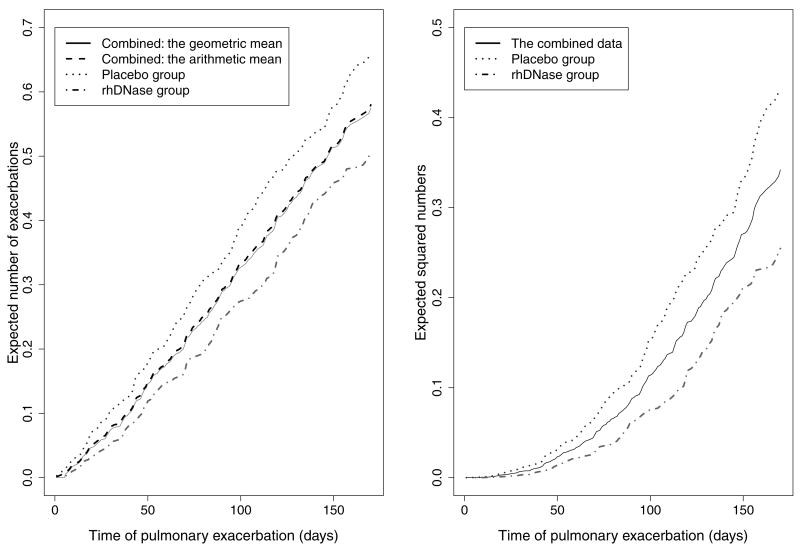
Figure 2.
The expected number of events (left) and the expected squared number of events (right) over time in the rhDNase trial. In the left plot, the solid line and the dashed line are combined data with the geometric mean and with the arithmetic mean, respectively. In the right plot, the solid line is combined data. In both panels, the dotted line is the placebo group, and the dash-dotted line is the rhDNase group.

