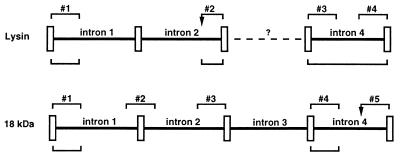
Figure 3.
Diagram of exons and introns of lysin and 18-kDa genes (not to scale), showing segments sequenced. Rectangles denote the five exons. Sequences compared between H. rufescens individuals are shown by numbered brackets above the gene (Table 3). Comparisons between species (H. rufescens, H. corrugata, and H. fulgens) are shown by brackets below (Table 2). Arrows in segment 2 of lysin and segment 5 of 18 kDa indicate positions of a poly-G region and CA microsatellite.

