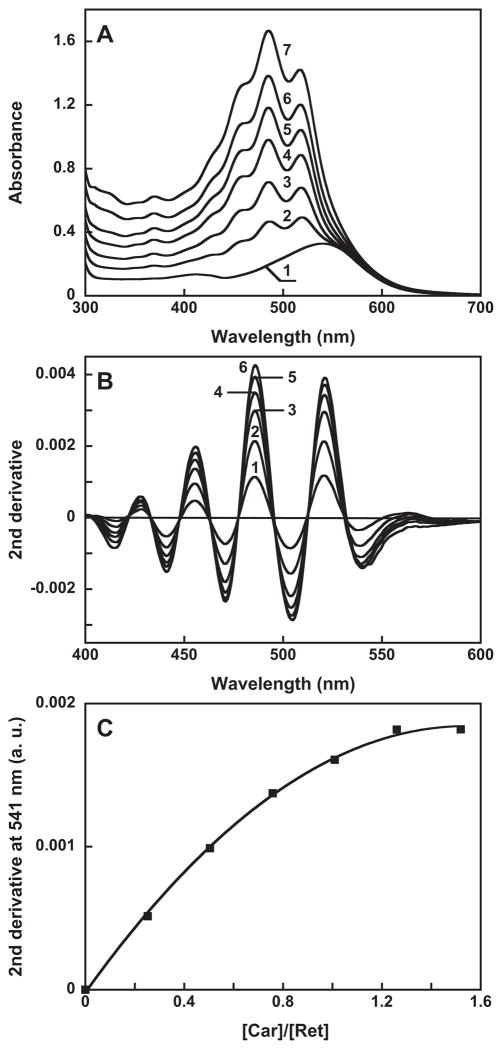
Figure 4.
Titration of gloeobacter rhodopsin with salinixanthin. A. Absorption spectra of: 1, untreated retinal protein, 16 μ 2 through 7, after addition of 4, 8,11,13,16 and 19 μ of salinixanthin. B. Second derivatives of spectra 2 through 7 in panel A (multiplied by minus 1). C. Titration curve, with the Y axis proportional to the amount of bound salinixanthin (in arbitrary units), estimated from the amplitude of second derivative of the difference spectra vs. the amount of added carotenoid (after correction for dilution).

