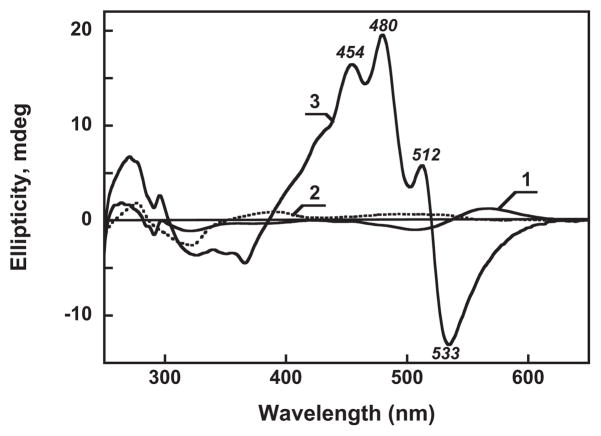
Figure 5.
Circular dichroism spectra of: 1, untreated gloeobacter rhodopsin in 0.02% DDM, pH 7.2, 100 mM NaCl; 2, salinixanthin in the same buffer; 3, after reconstitution. Concentration of gloeobacter rhodopsin and salinixanthin, ca. 16 μM. Absorption spectra of the samples are shown in Figure 3A, spectra 1, 2 and Figure 4A curve 6, respectively.

