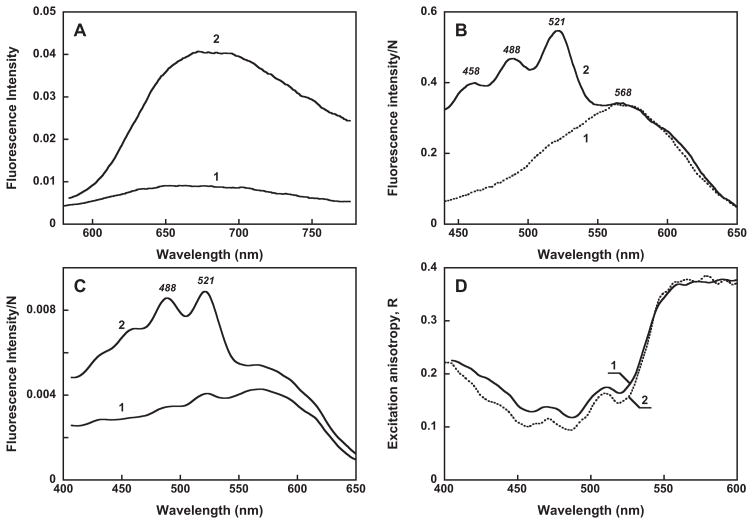
Figure 7.
Fluorescence, excitation and anisotropy spectra. A. Fluorescence spectra of gloeobacter rhodopsin at pH, 7.2 (spectrum 1) and 4.5 (spectrum 2). B. Excitation spectra for emission at 720 nm corrected for the light intensity N, pH 4.5: 1, untreated gloeobacter rhodopsin; 2, after reconstitution with salinixanthin. C. Excitation spectra of gloeobacter rhodopsin reconstituted with salinixanthin: 1, under parallel (both vertical) and 2, perpendicular (vertical excitation/horizontal emission) orientation of polarizers. Absorbance of the sample at the maximum was 0.32. D. Excitation anisotropy: 1, gloeobacter rhodopsin reconstituted with salinixanthin; 2, xanthorhodopsin, from (13)

