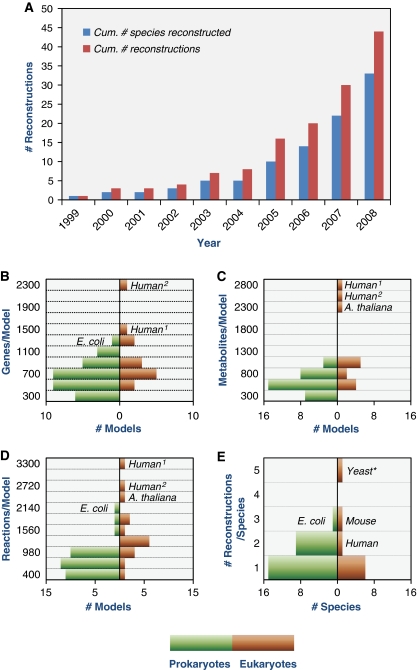
Figure 1.
Reconstruction statistics. The cumulative number of metabolic GENREs published over the past decade is shown in (A). (B–D) Histograms of the number of metabolic GENREs containing varying numbers of genes (B), metabolites (C), and reactions (D). (E) Histogram of the number of reconstructions published per species. All histograms display prokaryotic (green) and eukaryotic (brown) statistics. *Yeast, S. cerevisiae; Human1,2, human reconstructions (Duarte et al, 2007; Ma et al, 2007).

