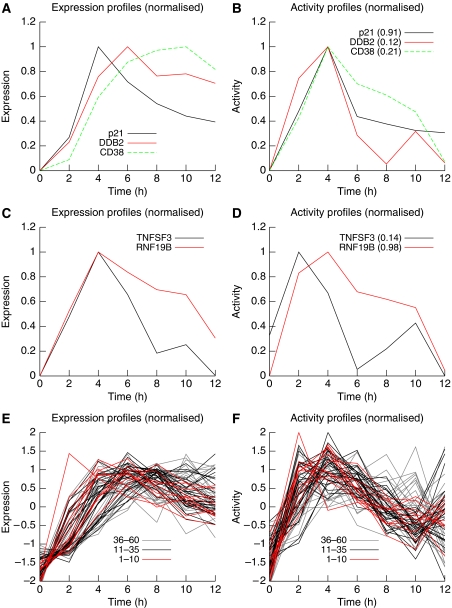
Figure 5.
Expression profiles and individual activity profiles for selected genes. (A) The normalized expression profiles of three verified p53 targets. Transcripts with a slower turnover rate (DDB2 and CD38) accumulate slowly and peak later than other genes (p21) for which degradation rate is higher. (B) Subtracting the degradation component reveals the production component. The individual activity profiles are similar because the three genes under review are activated by the same transcription factor, p53. (C) Despite having different activators (NF-κB and p53, respectively), genes TNFSF3 and RNF19B exhibit similar expression profiles. (D) TNFSF3 expression results from the combination of a fast onset activation (controlled by NF-κB) with a relatively ‘slow' degradation component. In contrast, RNFB19B is activated by a ‘slower' transcription factor (p53) but tends to track its movement more closely because of a relatively high transcript turnover rate. (E, F) are the same as (A, B), respectively, but include more predicted p53 targets, the top 60 (A, B represent the top three predictions). Contrasting the profiles shown in (E, F) helps creating a more coherent image. Ranking of the genes in the prediction list has been colour-coded and shows that lower ranked genes exhibit a more noisy profile, calling for a principled way to attribute genes individually to global activities.

