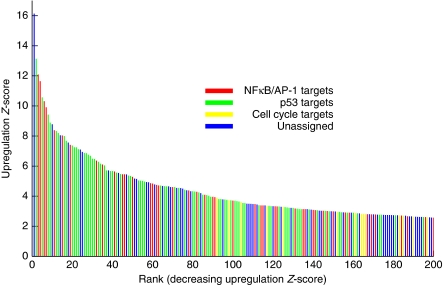
Figure 7.
GWTM predicts a large majority of the upregulated transcripts. A Z-score representing degree of DNA damage-induced upregulation was computed for each differentially expressed gene. GWTM-predicted targets of each of the three principal activities are highlighted (red, NF-κB- or c-Jun/AP-1-predicted targets; green, p53-predicted targets; yellow, cell cycle-predicted targets). The blue coloured bars correspond to genes that were not predicted to be direct targets of any of the three activities. Some of those may be co-regulated targets of more than one activity. For example, the most highly regulated gene, IER3, is a target of both NF-κB and p53.

