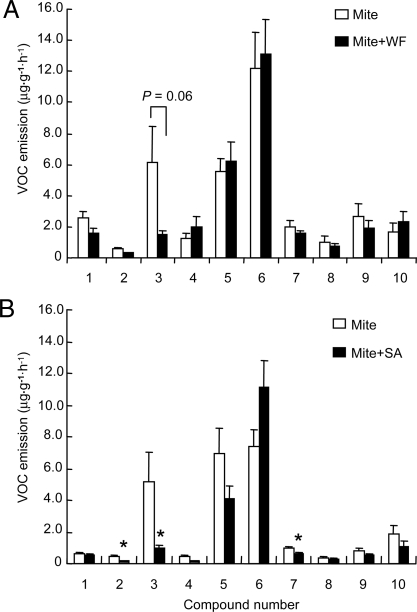
Fig. 2.
Compounds identified in the headspace of Lima bean plants. (A) Comparison of mean (± SE) (n = 9) emission rate of volatiles from plants infested with T. urticae only and plants simultaneously infested with T. urticae and B. tabaci. (B) Comparison of mean (± SE) emission rate of volatiles from plants infested with T. urticae only and plants simultaneously treated with T. urticae and SA. Peak numbers represent: 1, (Z)-3-hexenyl acetate; 2, (Z)-β-ocimene; 3, (E)-β-ocimene; 4, linalool; 5, (E)-4,8-dimethyl-1,3,7-nonatriene; 6, methyl salicylate; 7, C10H16O (unknown); 8, indole; 9, β-caryophyllene; 10, (E, E)-4,8,12-trimethyltrideca-1,3,7,11-tetraene. Asterisks represent significant differences (*, P < 0.05) from T. urticae-infested plants as determined by Fisher protected least significant difference (PLSD) test of ANOVA. SA, salicylic acid; WF, whitefly B. tabaci; mite, spider mite T. urticae.

