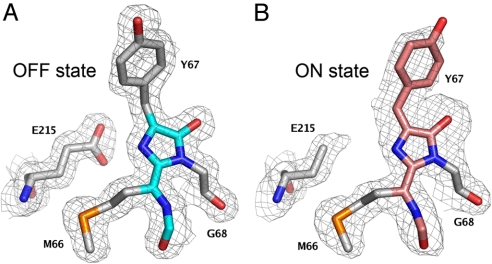
Fig. 1.
Structures of the PAmCherry1 chromophore in the OFF (A) and ON (B) states superimposed onto the respective experimental 2Fo-Fc electron density maps (contoured at 1σ) are shown. The chromophore moiety is shown in stick representation colored in cyan (OFF state) or pink (ON state), respectively. More diffused electron density indicates that traces of the OFF state and some intermediate conformations may be present in the ON state.

