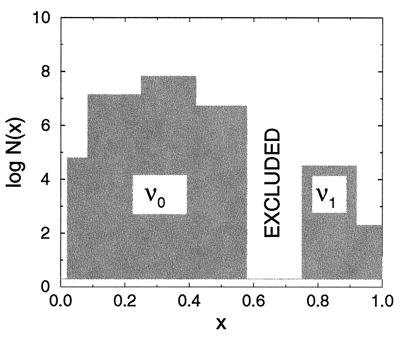
Figure 4.
Bar graph schematic of the model sequence space. The shaded areas correspond to sequence families folding to the ν0 and ν1 core geometries. The height of each shaded bar is the logarithm of the number of sequences log N(x) folding to the structure type at x. The unshaded (excluded) region contains only frustrated FRUST sequences. When λ0 passes below the frustration maxima in Fig. 3, this unshaded region is physiologically excluded. A spontaneous double or triple exchange mutation is required to mutate across the gap.

