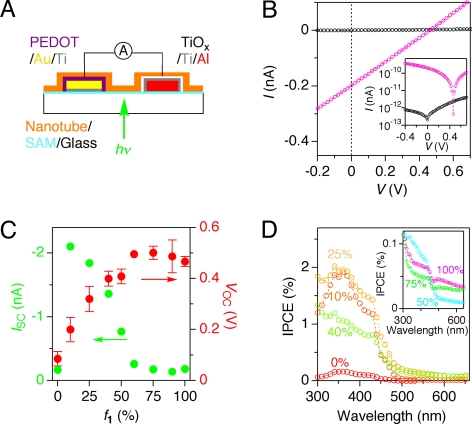
Fig. 5.
PV performances of the homotropic and coassembled nanotubes of 1 and 2. (A) Schematic illustration of the device configuration for PV measurements. (B) I–V profiles of a cast film of the nanotube of 1 in the dark (black) and upon photoirradiation (pink, λ = 300–650 nm, 0.39 mW mm−2). (Inset) log I–V profiles of a cast film of the nanotube of 1 in the dark (black) and upon photoirradiation (pink). (C) Plots of VOC (red) and ISC (green) versus f1. (D) IPCE spectra of cast films of the nanotubes with f1 = 0%, 10%, 25%, and 40%. (Inset) IPCE spectra of cast films of the nanotubes with f1 = 50%, 75%, and 100%.

