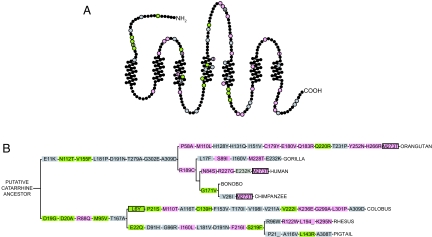
Fig. 3.
Nonsynonymous mutations in OR7D4 contribute to its functional divergence. (A) OR7D4 snake plot with amino acid changes from the catarrhine, Great Ape, and hominine ancestors indicated by nonblack circles. An F test that compares the best-fit values of EC50 of the ancestors with those of each of the synthetic mutants was carried out to assess whether the dose–response curves of a mutant is significantly different from those of the respective ancestors. Residues are colored in pink for decreased function, gray for no significant change, and green for increased function. (B) All of the synthetic mutations from the reconstructed hypothetical ancestors are represented on an accepted catarrhine cladogram. Positively selected sites as predicted by the M8 positive selection model of PAML using the OR7D4 only dataset (Table S5) and synthetic mutants that change function from A are plotted accordingly. Boxes are outlined in black for positive selection and are colored in pink for decreased function, gray for no significant change, and green for increased function.

