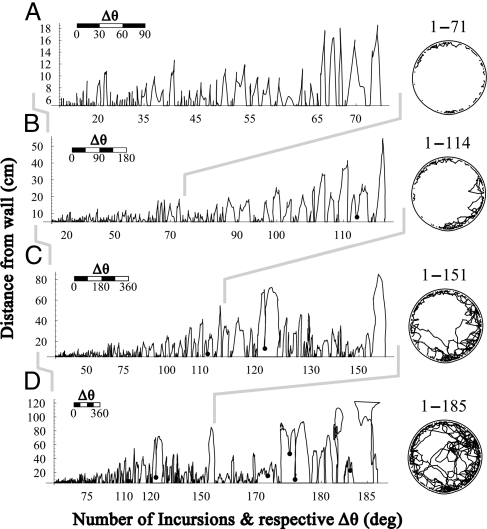
Fig. 4.
The build up of amplitude and complexity of incursions. (A–D) Incursions are plotted side-by-side in the order of their performance, from the initial incursion to the incursion that reached the center, in a selected BALB/c mouse-session. For each incursion the x-axis demarcates the angular section (Δθ) it covers for that incursion along the wall, and the y-axis demarcates arena radius. Each of the graphs starts with the first Incursion and includes progressively later incursions. Black dots represent border-related shuttles. Cumulative paths of the respective incursions are plotted on the right of each graph. Numerals above circles represent the range of plotted incursions.

