
FIGURE 2.
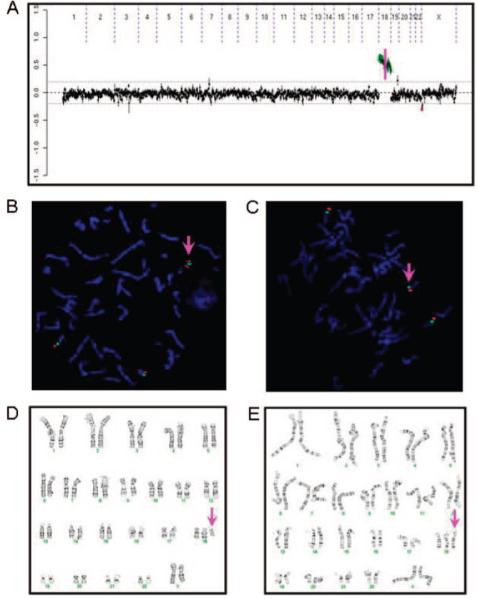
CMA ratio plot, FISH, and karyotype analyses for mosaic trisomy 18 in a female neonate with DFs and failure to thrive. A, Different copy-number gains for chromosome 18p and 18q (separated by a pink vertical line) detected by CMA. B and C, FISH using chromosome 18 centromere probe (green) and a probe for 18p (red) showing i(18p) (B) and trisomy 18 (C). D and E, Karyotype analysis showing i(18p) (D) and trisomy 18 (E).