
Figure 1. Expression of HMGA2 in osteoblast-like cell lines.
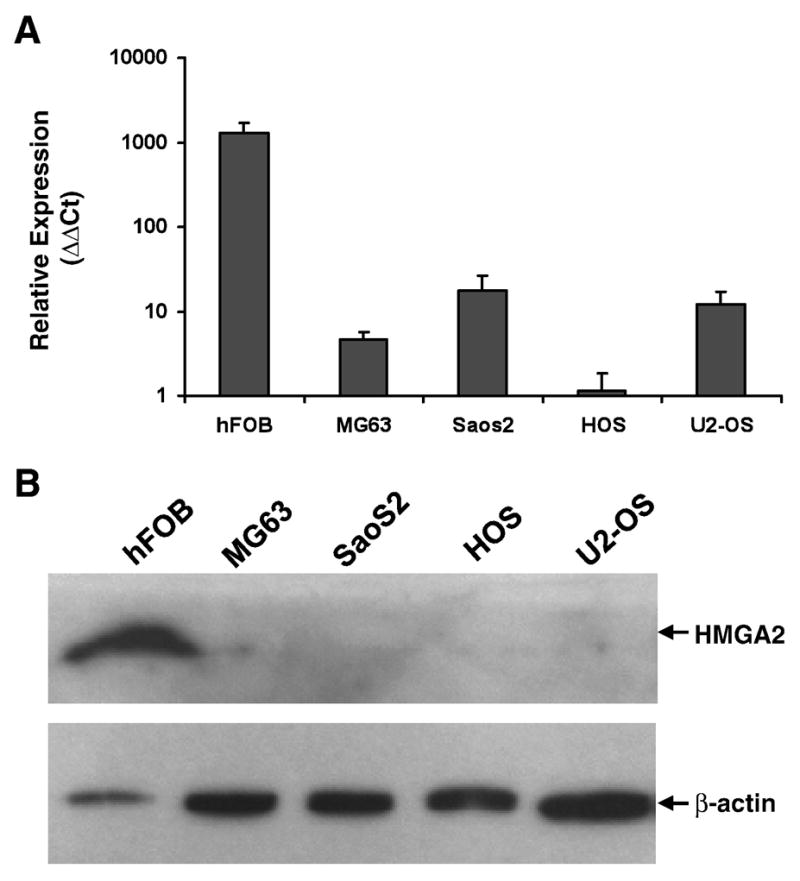
A. Quantitative RT-PCR of HMGA2 using total RNA isolated from each cell line. Relative expression level (ΔΔCt) was calculated using ΔCt of HOS as a reference. B. Western blot analysis of HMGA2 protein. B-actin was used as an internal control to demonstrate protein loading. The locations of HMGA2 and β-actin are labeled with arrows.