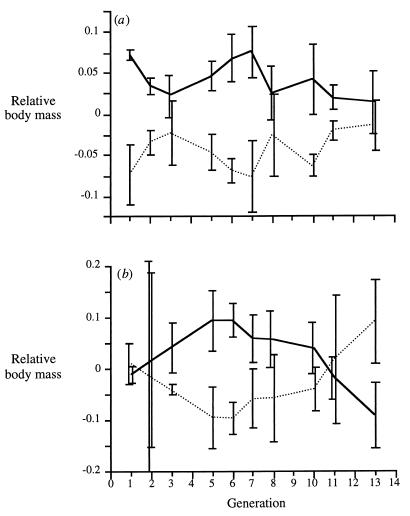
Figure 2.
Body mass in M line (solid line) and S line (dashed line) males (a) and females (b). The lines illustrate the difference between the mean for the three lines within a treatment and the mean for all six replicates. Error bars are ±1 SE for mean of the three replicates within each treatment.

