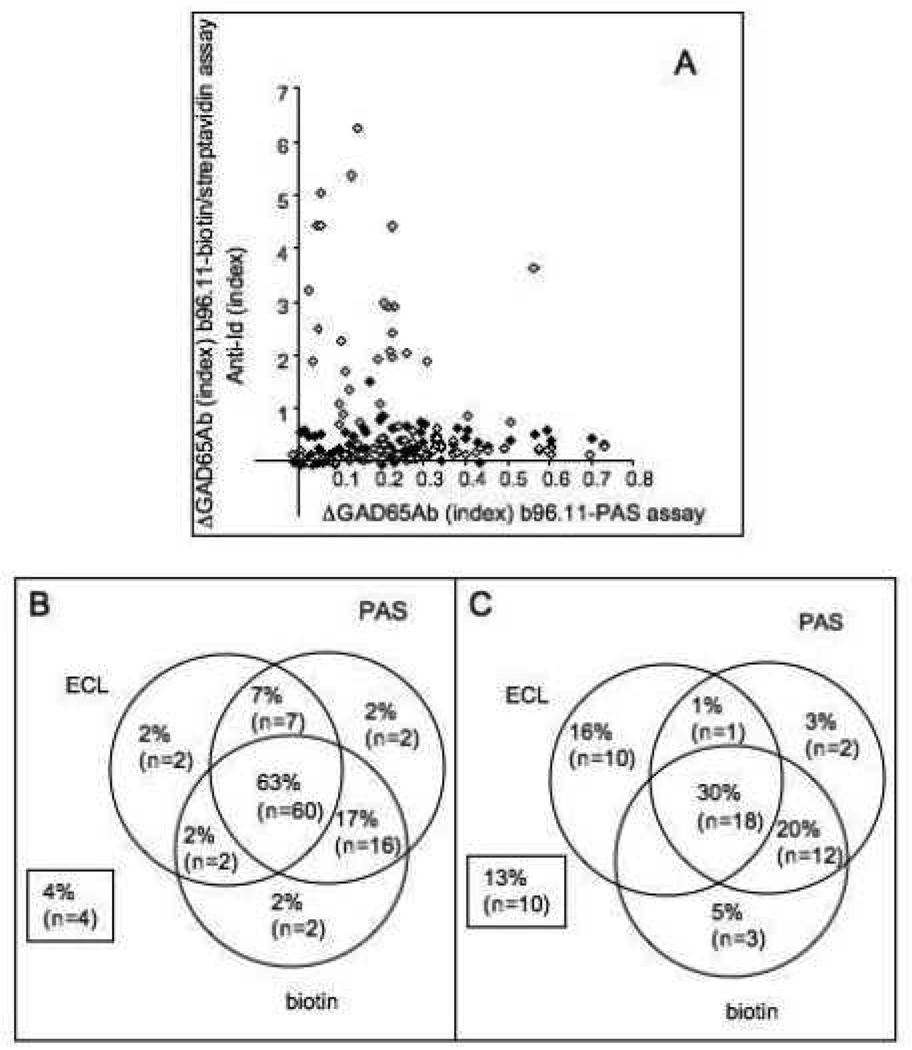
Figure 5. Direct comparison of three assays measuring GAD65Ab-specific anti-Id.
A: Anti-Id levels as determined by b96.11-PAS assay are correlated with anti-Id levels determined by b96.11-biotin/streptavidin assay (black) and ECL (white). Anti-Id levels determined in the absorption assays are shown as difference in GAD65Ab index prior and after absorption, while anti-Id levels determined in the ECL are shown as relative index.
Frequency (% and total numbers) of anti-Id positive samples as determined in the three assays is shown for control samples (B) and T1D patients (C). Samples that did not test positive in any of the assays are indicated in the boxes.

