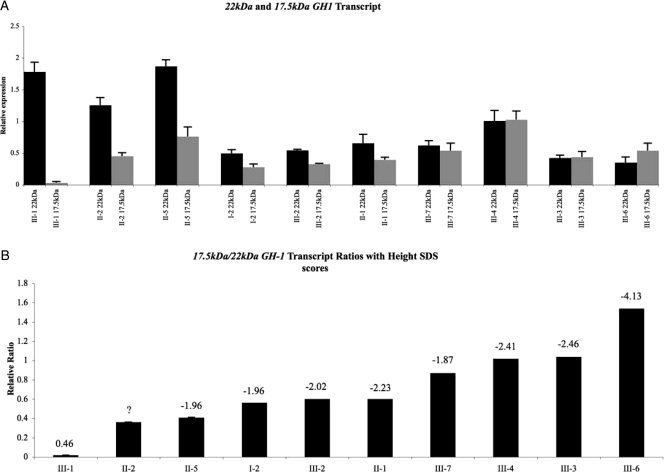
Figure 3.
A, 17.5-kDa (gray) and 22-kDa (black) GH1 transcript levels as measured by relative real-time PCR analysis. B, The relative transcript ratios of 17.5- kDa/22-kDa in CL cell lines derived from the kindred presented in Fig. 1. Numbers above the columns in panel B represent Ht SDS. Question mark indicates that Ht SDS of II-2 are not known. Family member II-4 was not included in the figure because we could not calculate his Ht SDS due to missing height information (his relative transcript ratio was 0.1, as would be expected for a normal person); additionally, because this person married into the kindred, we felt that he would not be an appropriate control. Each sample was done in triplicate, and analysis was repeated three times. Error bars represent sem.

