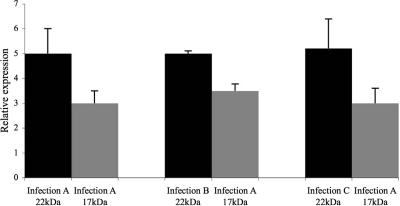
Figure 4.
17.5-kDa (gray) and 22-kDa (black) GH1 transcript levels as measured by relative real-time PCR analysis. The relative transcript ratios of 17.5- kDa/22-kDa in three different CL cell lines derived from the same individual (I-2) from the kindred shown in Fig. 1. Each sample was done in triplicate, and analysis was repeated three times. Error bars represent sem.

