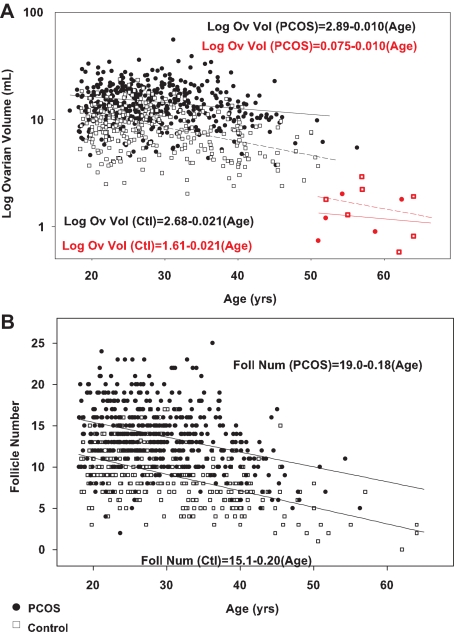
Figure 3.
Log ovarian volume (A) and follicle number (B) as a function of age in PCOS (black circles) and control subjects (open squares) and postmenopausal PCOS (red circles) and control subjects (red squares). Our pathology study demonstrated no follicles in postmenopausal women; therefore, there are no postmenopausal women included in the panel depicting follicle number (B). The slope of the log ovarian volume regression line is significantly different in PCOS and control subjects (P < 0.01).

