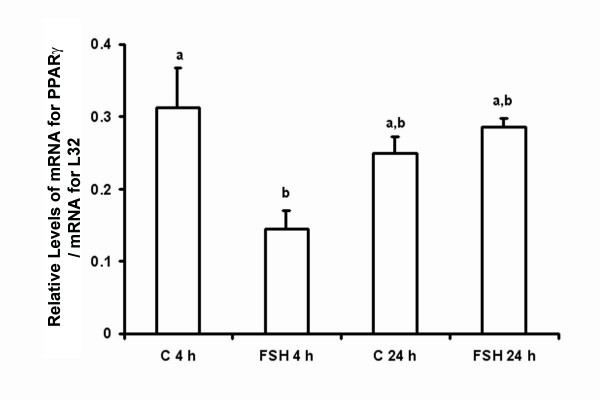
Figure 6.
Relative levels of mRNA for PPARγ in rat granulosa cells cultured in vitro as described in the Methods for 4 or 24 hours (h) (n = 3 independent experiments). Data are presented as means ± SEM. Bars with no common superscripts are significantly different (p < 0.05). C = control; FSH = 50 ng/ml.

