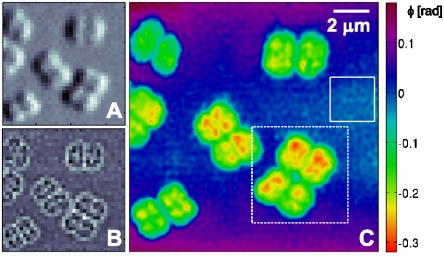
Fig. 2.
Ptychographic diffractive imaging of freeze-dried D. radiodurans cells (1-s dwell time). (A) Differential phase contrast image of a subset of the scanned region. One pixel corresponds to one scan point (pixel size is 400 × 400 nm2). (B) Dark-field contrast image of the same region as shown in A. (C) PCDI reconstruction of the object transmission function (phase) in the same region as shown in A and B. The area marked by the dashed white frame was scanned again in a subsequent scan with longer dwell time (Fig. 3). The standard deviation of the phase within the solid rectangle is 0.013 rad.

