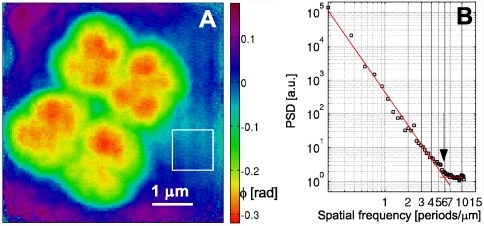
Fig. 3.
(A) Reconstructed phase map of a PCDI scan on a single, tetrameric D. radiodurans cell (60-s dwell time). The scanned region corresponds to the area marked by a dashed white frame in Fig. 2C. The standard deviation of the phase within the solid rectangle is 0.017 rad. (B) PSD of the complex object transmission function corresponding to the phase map shown in A. The result of a fit of an exponential power law to the PSD in the interval [0.1,5] μm-1 is shown by the decaying red line. The additional red line indicates the mean value of the PSD for frequencies > 7 μm-1. The transition point between both regions (at 5.9 μm-1) is marked by an arrow.

