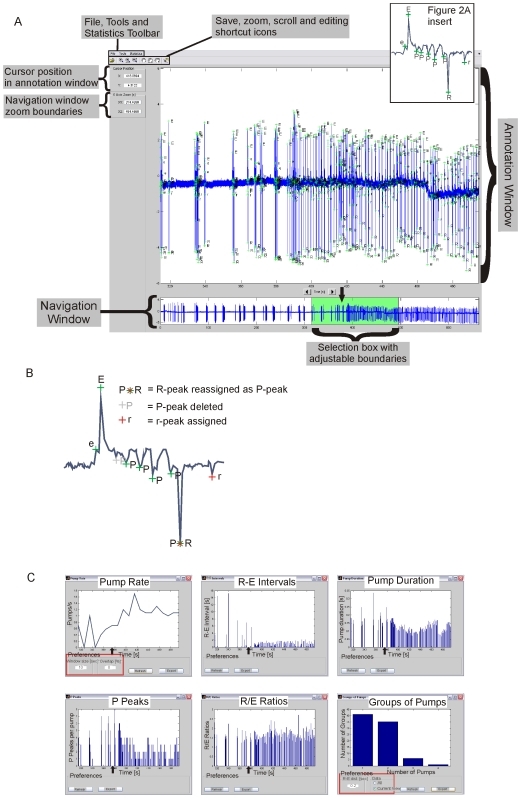
Figure 2. Overview of the AutoEPG system.
A) A labeled screenshot of the AutoEPG graphical user interface. An example of an EPG recorded from a wild-type N2 worm is shown to demonstrate the capabilities of the interface. Briefly, after 6.2 min of recording in Dent's saline 100nM 5-HT, a potent stimulator of pharyngeal pumping, was applied. The entire recording is displayed in the navigation window and the time point at which 5-HT was applied is indicated by the black arrow (this was added retrospectively). The region of the trace consisting of 1 min immediately prior to 5-HT application and 2 min after application is easily selected in the navigation window (highlighted in green by AutoEPG). This selected region is displayed in the annotation window, where the algorithm annotation of the recording can be viewed. The highlighted region selected can be altered by simply clicking and dragging the left and right edges of the green box in the navigation window, or by clicking on the highlighting box and dragging it left or right with the mouse. Figure 2A Insert. An EPG waveform as it would appear having been annotated by the AutoEPG algorithm B) A cartoon illustrating the editing functions available in AutoEPG. C) Screenshots of the statistics that can be performed using AutoEPG. The pump rate, R-E interval, pump duration, P-peaks/pump and R/E-ratio/pump are displayed for the region of the recording selected in the navigation window in Figure 2A. The default of the statistics functions is to display data for the entire recording. However, when a region is selected in the navigation window the statistics function updates itself to display the statistics for the region of interest. In each case the black arrow indicates the time point at which 100nM 5-HT was applied (this has been added retrospectively). The groups of pumps statistic was performed on the first 2 minutes of the 5-HT application. The user-modifiable preferences of the statistics pump-rate and groups of pumps are outlined in red. In the case of pump duration, P-peaks and R/E-ratios each bar in the graphical output represents a single pump, with time on the x-axis. In the case of pump rate the user-modifiable preference ‘Window size (sec)’ refers to the time base used to plot the instantaneous rate, i.e if the size of window is set to 10 seconds as in this example, the pumps/sec will be calculated for each consecutive 10 sec ‘window’ of the trace. In the case of groups of pumps in this example the time interval has been set to 200 msec (i.e. consecutive pumps that occur within 200 msec of each other will be classified by AutoEPG as belonging to the same group). The analysis can be performed on the ‘Current View’ which is the region selected in the navigation window or on the entire trace by selecting ‘All.’

