
Figure 2. Chk1 and ATR are implicated in Lats2 accumulation in response to activated H-Ras.
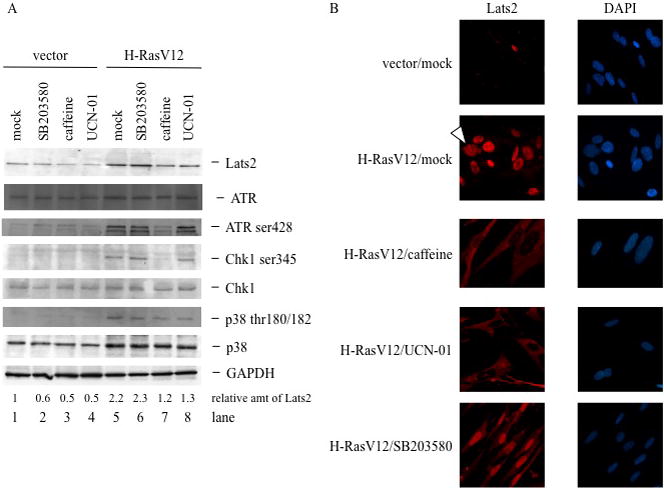
(A) Cells were infected as in Fig. 1A. Four days after infection, hygromycin-resistant cultures were treated overnight with either 10μM SB 203580, 0.5μM UCN-01, or 100μM caffeine, or left non-treated (mock). Cell lysates were subjected to Western blot analysis to visualize ATR, phospho-ATR, total Chk1, phospho-Chk1, p38 and phopho-p38. (B) Cells were processed and treated as in (A), fixed and immunostained to visualize Lats2. Nuclear DNA was visualized by DAPI staining. Arrowhead denotes cell with micronuclei. Protein signals were quantified using ImageJ software and normalized to the corresponding GAPDH signals.