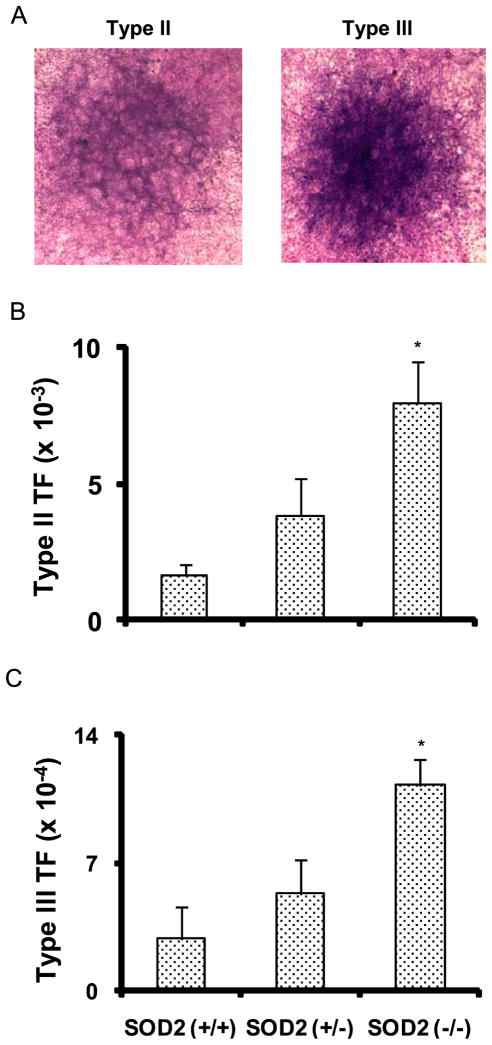
Figure 2. Increased transformation frequency in irradiated SOD2 (−/−) compared to SOD2 (+/+) MEFS.
Clonogenic MEFs were seeded on 30 Gy irradiated hamster fibroblasts feeder cells, and at 24 h post-plating monolayer cultures were irradiated with equitoxic doses of ionizing radiation (dose rate, 0.83 Gy/min): 6.8 Gy for SOD2 (+/+); 4.4 Gy for SOD2 (+/−); 5.6 Gy for SOD2 (−/−) MEFs. Cells were continued in culture for 6–8 weeks; (A) representative microscopy pictures of Giemsa-stained monolayers containing Type II and III foci; transformation frequency of Type II (B) and Type III (C) foci calculated as the ratio of transformed foci relative to the number of viable cells.

