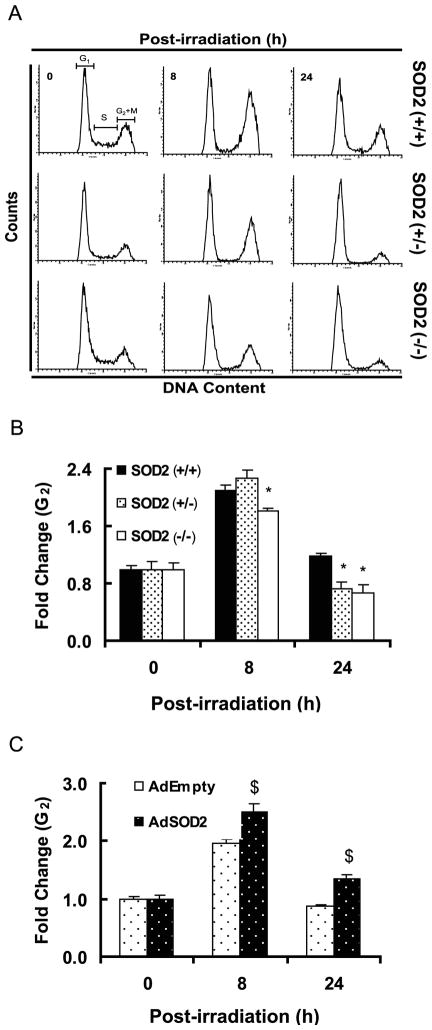
Figure 5. G2-exit is accelerated in irradiated SOD2 (+/−) and SOD2 (−/−) compared to SOD2 (+/+) MEFs.
Asynchronously growing exponential MEFs were irradiated with 5 Gy and harvested at indicated time for flow cytometry measurements of DNA content. Representative DNA histograms are shown in (A); (B) fold-change in G2 was calculated relative to 0 h un-irradiated control for individual cell types; the percentage of G2 in un-irradiated MEFs was as follows: SOD2 (+/+), 22%; SOD2 (+/−), 19%; SOD2 (−/−), 17%. *, p<0.05 vs. SOD2 (+/+) MEFs. (C) SOD2 (−/−) MEFs were infected with AdEmpty and AdSOD2, and irradiated with 5 Gy at 72 h post-infection. Cell cycle phase distributions analyzed at indicated times, and fold change in G2 calculated. $, p<0.05 vs. AdEmpty infected cells.

