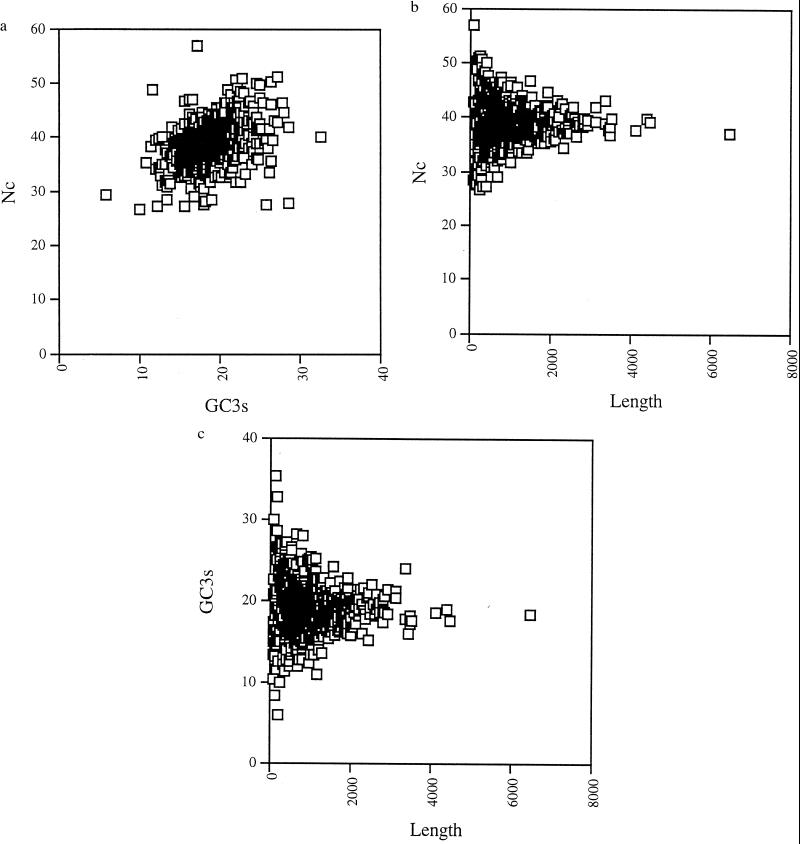
Figure 2.
(a) Plot of Nc versus GC3s. There is a slight reduction in Nc for genes with lower GC3s values. (b) Plot of gene length in nucleotides against Nc. The plot appears to assume the shape of a normal distribution. Shorter genes have a much wider variance in Nc values, with longer genes showing a much more restricted set of values. (c) Plot of gene length in nucleotides against GC3s. In this plot also, there is a much greater variance among smaller genes. The genome seems to be in a state of equilibrium for both measures, with the only variance being attributable to sampling.

