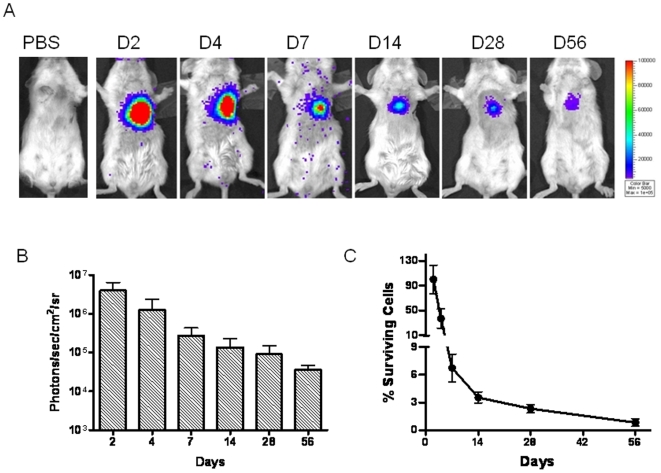
Figure 6. Molecular imaging of hESC-EC fate after transplantation.
(A) A representative animal injected with 1×10⁶ hESC-ECs shows significant bioluminescence activity at day 2, which decreases progressively over the following 8 weeks. A representative control animal injected with PBS shows no imaging signals as expected. (B) Detailed quantitative analysis of signals from all animals (n = 28) transplanted with hESC-ECs (signal activity is expressed as photons/sec/cm2/sr). (C) Donor cell survival plotted as % signal activity from day 2 to week 8.

