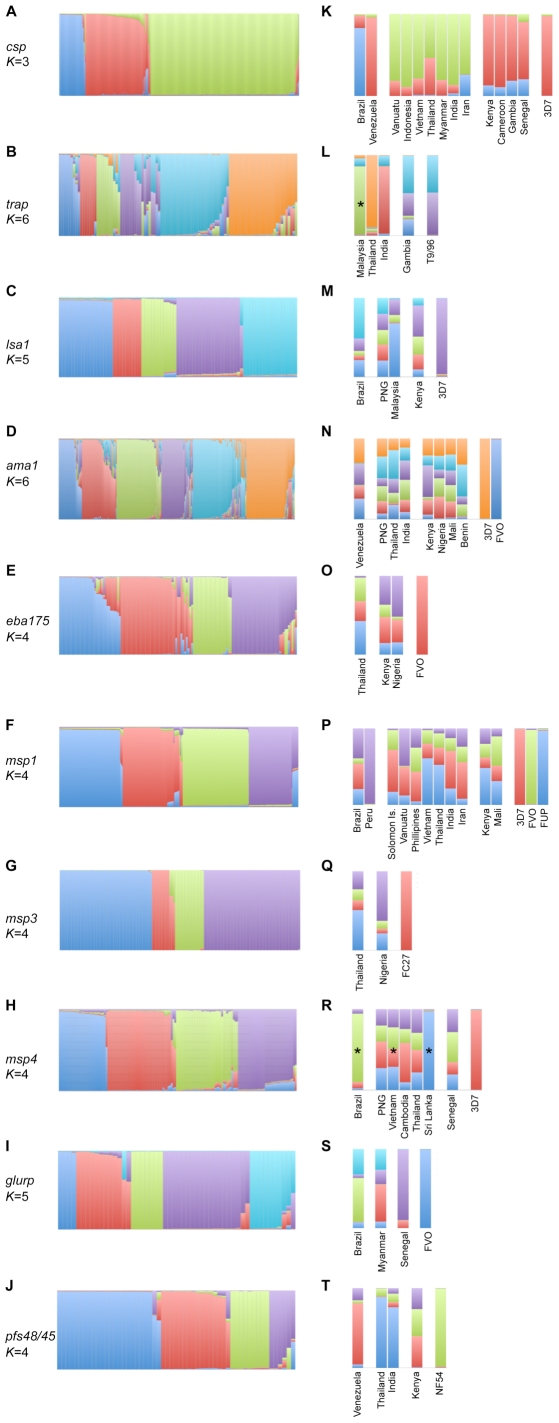
Figure 2. Global population structure of the genes encoding ten P. falciparum vaccine antigens based on Bayesian cluster analysis.
Membership coefficients for A–J) individual nsSNP haplotypes and K–T) the population average for the estimated number of clusters (K, shown on the left of the two histograms). In the latter, countries from different continents are separated by a blank space and organised from east on the left, to west on the right with vaccine haplotypes on the far right hand side. An asterisk denotes countries for which fewer than 8 haplotypes were available that were taken from dataset 2 (Table S2). Dark blue = cluster 1; Red = cluster 2; Green = cluster 3; Purple = cluster 4; Light blue = cluster 5; Orange = cluster 6.

