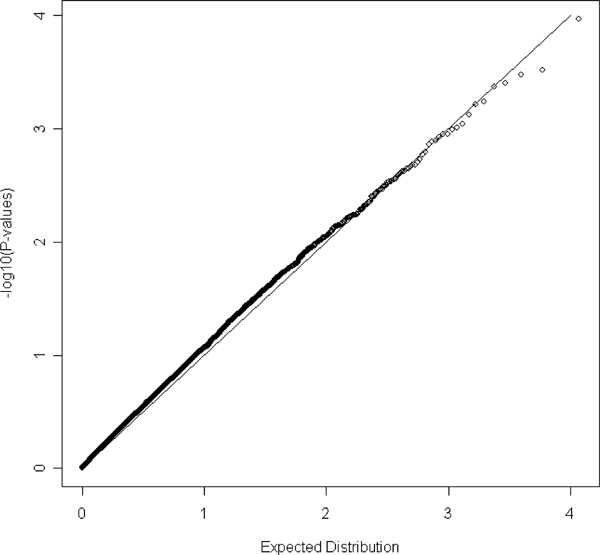
Figure 2.

The Q-Q plot for the empirical p-values in the model incorporating age, sex and BMI. -log10(p-value) is plotted against its expected value under the null hypothesis. A 45-degree line would be expected if the results are due to chance alone.
