
Figure 1.
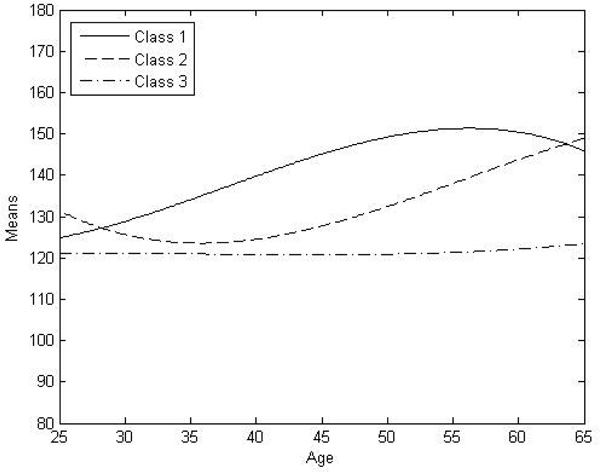
Growth curves of the three latent classes over time. Age is on the x-axis. The mean systolic blood pressure (SBP) is indicated on the y-axis.
Official websites use .gov
A
.gov website belongs to an official
government organization in the United States.
Secure .gov websites use HTTPS
A lock (
) or https:// means you've safely
connected to the .gov website. Share sensitive
information only on official, secure websites.
Growth curves of the three latent classes over time. Age is on the x-axis. The mean systolic blood pressure (SBP) is indicated on the y-axis.