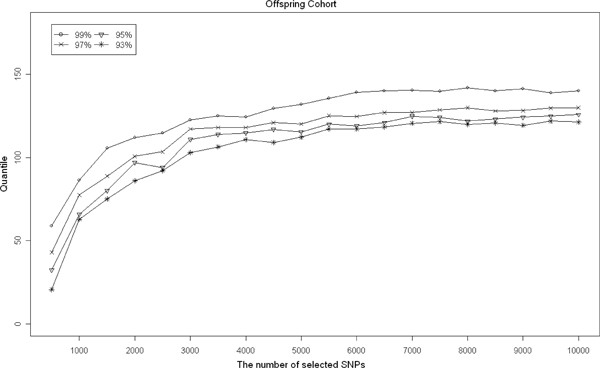
Figure 1.

The trends of the quantiles (93%, 95%, 97%, and 99%) with the increase of the number of selected SNPs based on the Offspring Cohort. The vertical axis represents the value of the quantile and the horizontal axis represents the number of selected SNPs in each permutation study.
