
Figure 1.
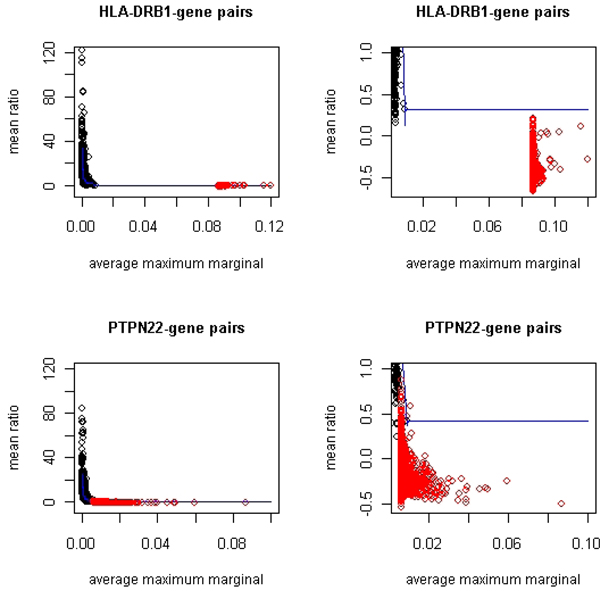
Observed (M, R) plane with curve threshold computed from permutations. Red dots are observed values (M, R) for gene pairs studied. The black dots are the 99.9% threshold for each bin calculated from 1000 permutations. The dark blue curve is the smoothing spline fitted to the 99.9% bin-thresholds. The right panel displays the same data as the left column with smaller scale to focus on the tail of the scatter.